
Built on Connections: Scaling Data Pipelines, Careers, and Communities in Copenhagen
Reflecting on Web Analytics Wednesday Copenhagen: why durable marketing performance and long-term career growth share the same underlying architecture of human and technical connections.
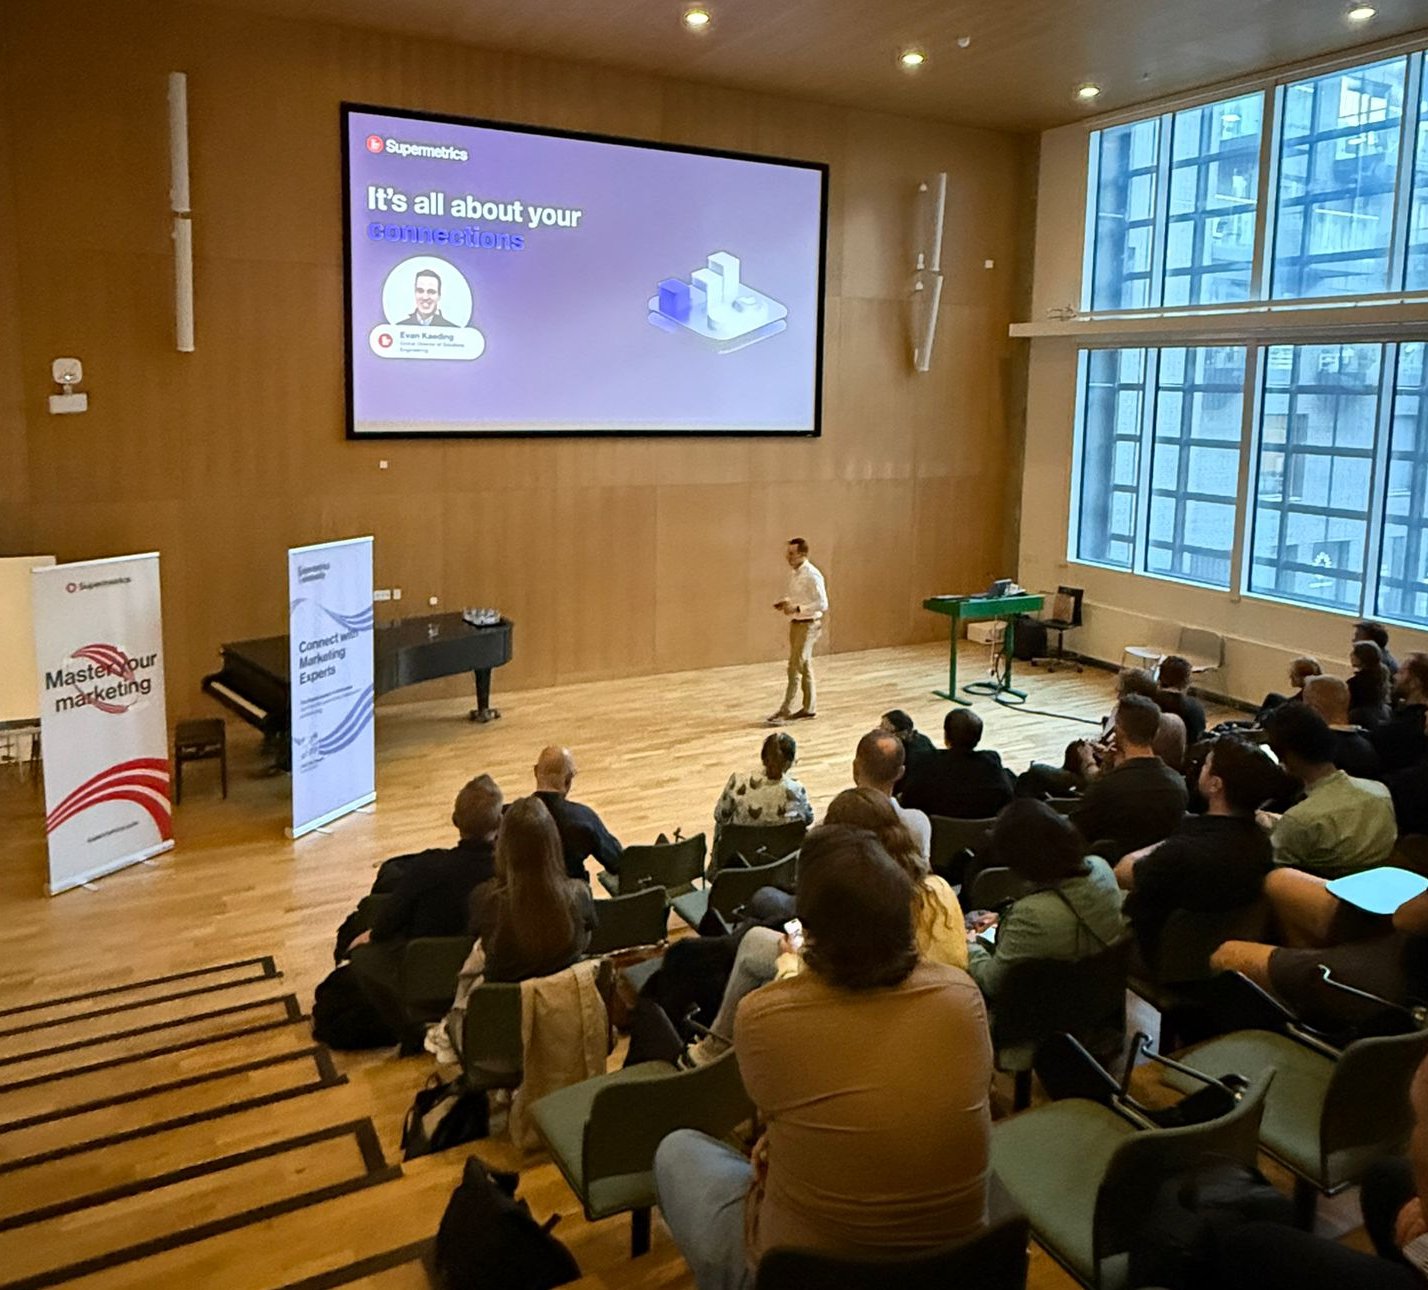 Evan Kaeding keynote at Web Analytics Wednesday Copenhagen: exploring how professional trajectories and modern data architectures scale through the power of connections.
Technical conferences tend to oscillate between two unproductive extremes. On one side sits the academic symposium, where theoretical architectures are debated in pristine isolation from commercial balance sheets. On the other sits the corporate vendor showcase, where stage-managed demonstrations glide over broken APIs, unaddressed schema migrations, and the grim operational reality of custom ETL scripts failing at three in the morning.
Web Analytics Wednesday Copenhagen (WAW-CPH), co-hosted in September 2025 with the Brand Leadership Community (BLC), was designed as an intentional departure from that routine. The room was packed with practitioners who spend their working weeks in the engine rooms of digital business: data architects, digital marketing directors, performance leads, and analytics engineers from across the Nordic ecosystem. They gathered not to admire slide decks, but to compare notes on what actually works when privacy legislation tightens, walled gardens restrict measurement, and executive teams demand verifiable incrementality rather than vanity impressions.
Stepping onto the stage to deliver the evening keynote, titled It’s All About Your Connections, my objective was not to pitch software. Instead, the goal was to examine an underlying symmetry governing our profession: the architecture of a resilient data pipeline mirrors the architecture of a durable career. Both are built entirely on connections. Both degrade quickly when treated as transactional afterthoughts. And both compound exponentially when engineered with deliberate intent.
Autumn Along Christianshavn: The European Analytics Climate
 Autumn in Copenhagen: arriving ahead of Web Analytics Wednesday to meet European partners and clients.
Arriving in Copenhagen in late September brings an immediate reminder of the macroeconomic and regulatory environment that European practitioners navigate daily. Walking along the canals of Christianshavn before the event, the contrast between European pragmatism and Silicon Valley hyperbole is unmistakable.
In North America, data discussions frequently tilt toward greenfield experimentation and aggressive tooling accumulation. In the Nordics, the lens is ruthlessly disciplined. Years of strict GDPR compliance, early cookie degradation, and consumer protection frameworks have fostered an intolerance for operational bloat. Practitioners here do not care about semantic layer rebranding if it fails to resolve identity fragmentation or if the connector requires ongoing maintenance that drains engineering sprints.
We are living through the prolonged hangover of the modern data stack buildout. Between 2018 and 2022, organizations invested heavily in centralizing data into cloud warehouses, assuming central storage would spontaneously generate business intelligence. Instead, many enterprises ended up with immaculate data lakes that acted as digital graveyards: partitioned tables that business stakeholders could not interpret, and performance teams could not operationalize back into active bidding systems. The practitioners filling the Copenhagen auditorium were managing rising customer acquisition costs across Meta and Google, navigating signal loss, and seeking reliable plumbing that translates raw ingestion into commercial margin.
A Career That Mirrors an Industry Stack
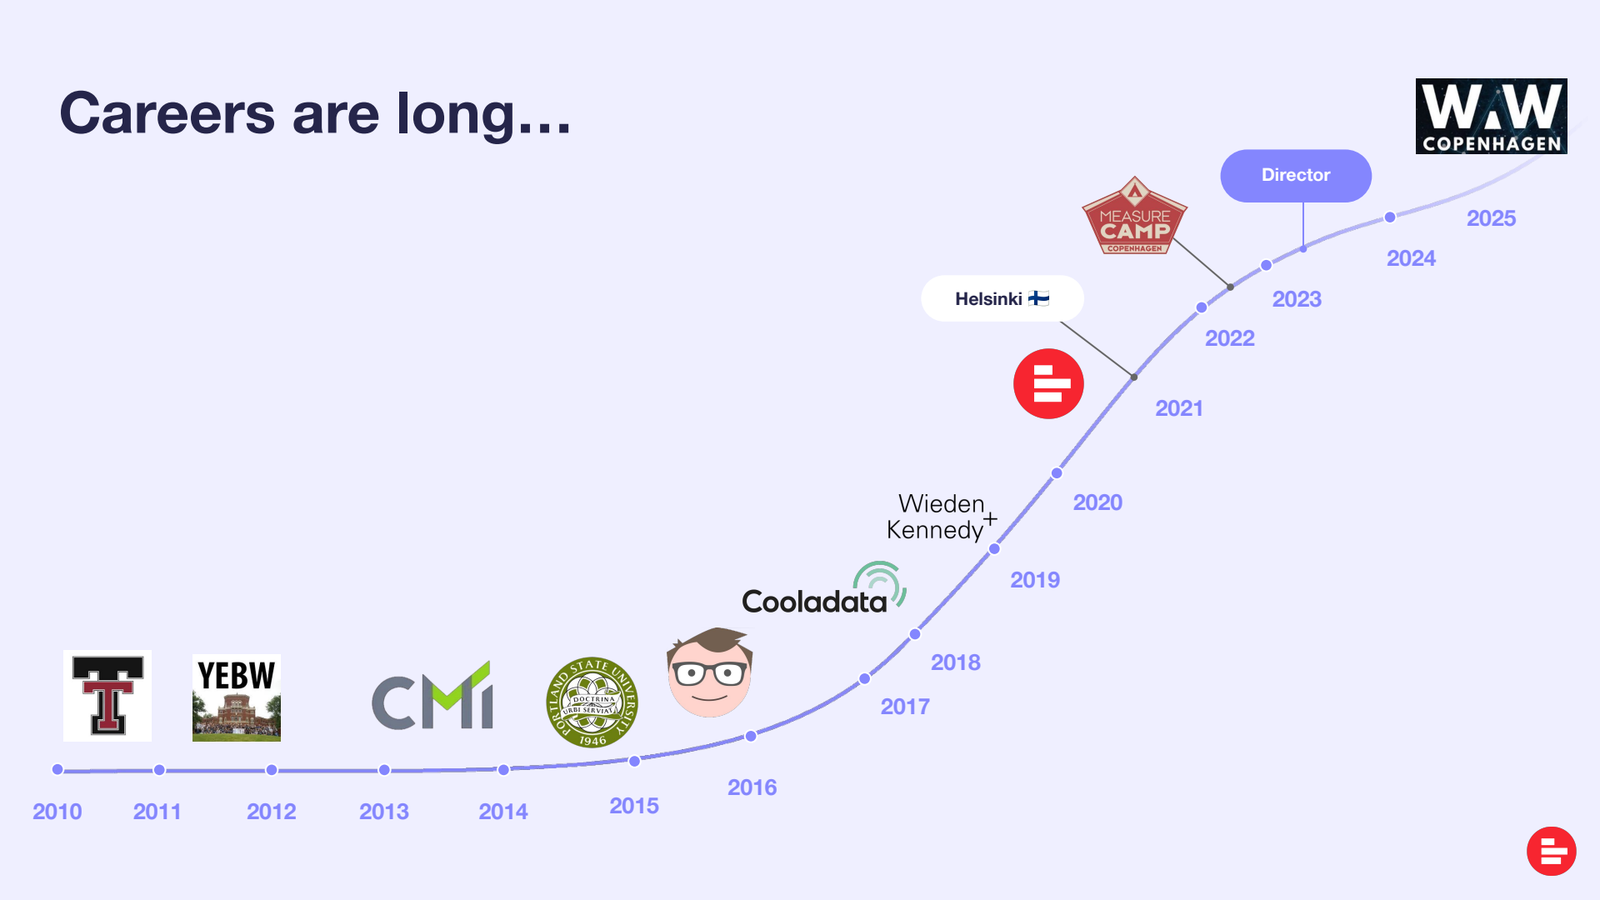 Careers are long: tracing fifteen years from Portland analyst to Global Director in Helsinki.
To explain how the ecosystem reached this bottleneck, I walked the audience through my own fifteen-year career arc. My professional path has mirrored the structural evolution of the marketing data industry itself.
In the early 2010s, working in early-stage Portland startups, my roles were unstructured. I was responsible for customer acquisition, analytics reporting, client support, and marketing automation simultaneously. The tooling was primitive. Ingestion meant manually logging into six disparate ad platforms every Monday, exporting CSVs with inconsistent schemas, and gluing them together inside desktop spreadsheets with brittle lookup formulas. That friction led me to become an early user of Supermetrics. What began as a lightweight utility for pulling Google Analytics metrics into spreadsheets immediately returned something invaluable: twenty hours a week previously wasted on manual extraction that could now be directed toward conversion diagnostics.
Later, moving to Wieden+Kennedy to manage global analytics for enterprise accounts like Nike and Procter & Gamble, the scale multiplied, but the underlying challenge remained identical. Enterprise organizations simply threw larger budgets at the problem, paying systems integrators millions to build custom ingestion pipelines that broke whenever an ad network quietly modified its API schema. In every environment, whether a five-person startup or a global agency, the conclusion was inescapable: building custom ingestion connectors in-house is an economic trap.
In 2020, I crossed the aisle to join Supermetrics in Portland before relocating to our headquarters in Helsinki. Over the past five years, moving from an individual solutions engineer to Global Director leading teams across North America, EMEA, and APAC, my perspective shifted from building individual dashboards to architecting enterprise systems. In solutions engineering, technical credibility is paramount. If you have spent late nights debugging OAuth tokens or reconciling currency conversion discrepancies across ad networks, you speak the same dialect as the systems architect across the table. You are not selling features; you are helping them avoid architectural dead ends.
The Trajectory of the Pipeline: From Plugin to Backbone
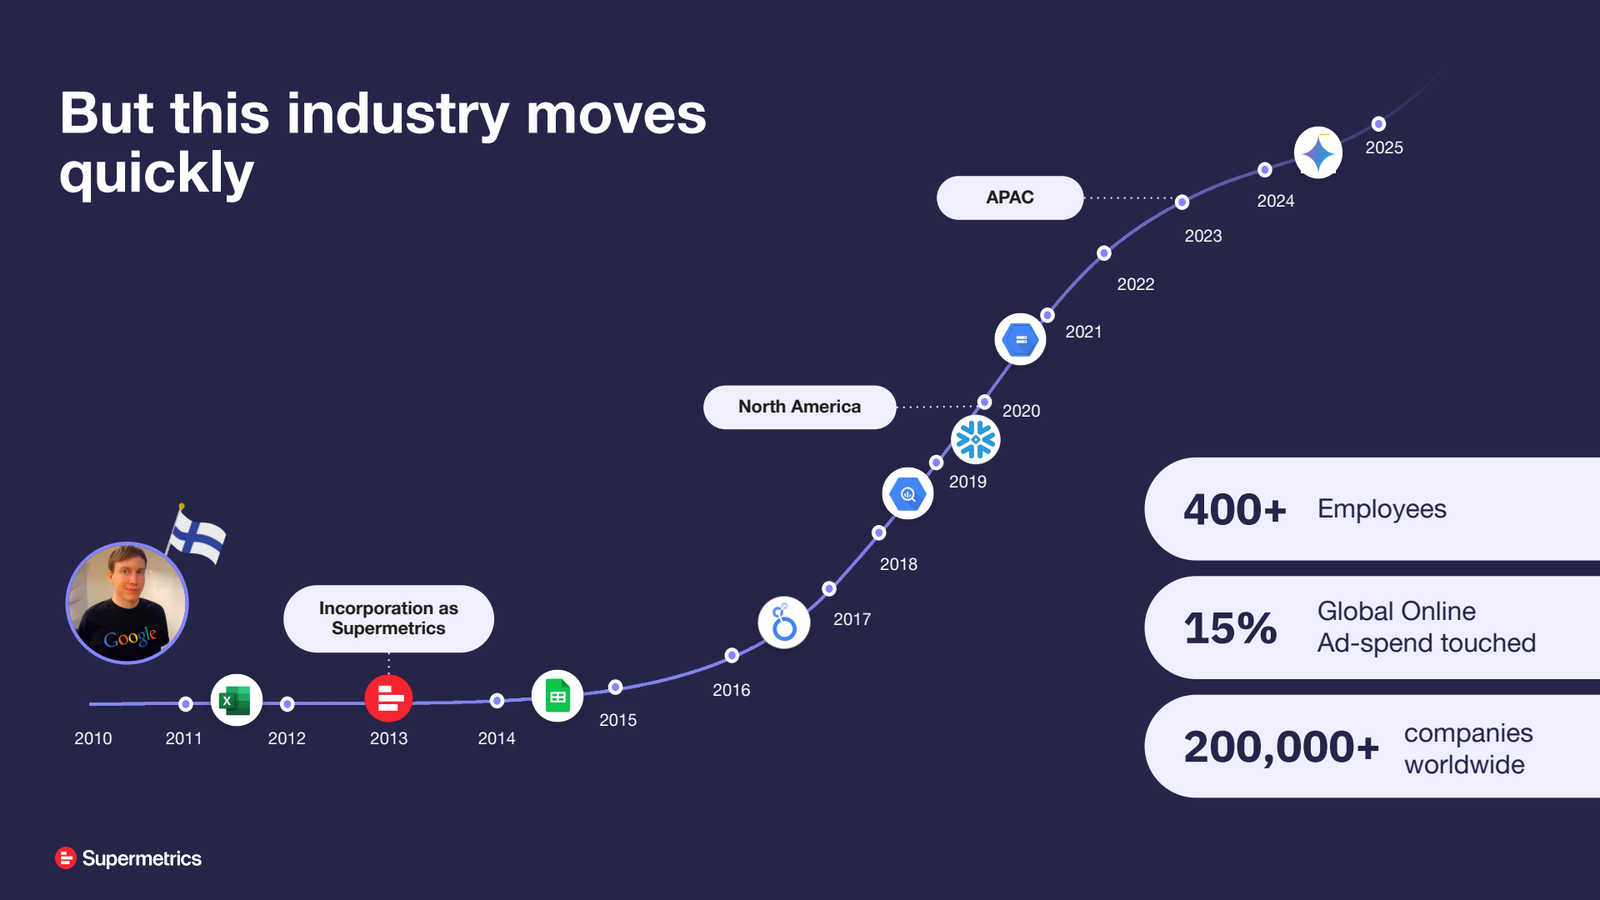 From a plugin contest winner to data infrastructure: Supermetrics scaling alongside the modern data stack.
The evolution of Supermetrics as a company closely tracks the broader maturation of the marketing analytics discipline over the last fifteen years.
The origin story is well known in Nordic tech circles: in 2010, Mikael Thuneberg entered a Google developer contest seeking a script to pull Google Analytics data into spreadsheets. He won the contest, received a Google t-shirt as the grand prize, and recognized that thousands of analysts shared his exact operational pain. That script became a commercial product, formally incorporating in 2013.
The company’s expansion reflected three distinct industry phases:
- The spreadsheet era (2010 to 2017), where marketing data was pulled directly into Google Sheets and Microsoft Excel for tactical manipulation.
- The business intelligence and cloud warehouse wave (2018 to 2022), where analysts moved to Looker Studio and centralized ingestion pipelines directly into Google BigQuery, Snowflake, Amazon S3, and Microsoft Azure.
- The modern era of headless infrastructure and closed-loop data activation (2022 to the present).
Today, Supermetrics employs more than 400 people across Helsinki, North America, and APAC. The platform serves over 15,000 commercial customers, touches over 200,000 businesses worldwide, and directly ingests and routes pipelines representing approximately 15 percent of total global digital ad spend. At that volume, the tool ceases to be a tactical utility; it becomes structural infrastructure. The central challenge shifts from basic transport to turning fragmented data into coherent commercial intelligence.
The Four-Stage Architecture: Connect, Manage, Analyze, and Activate
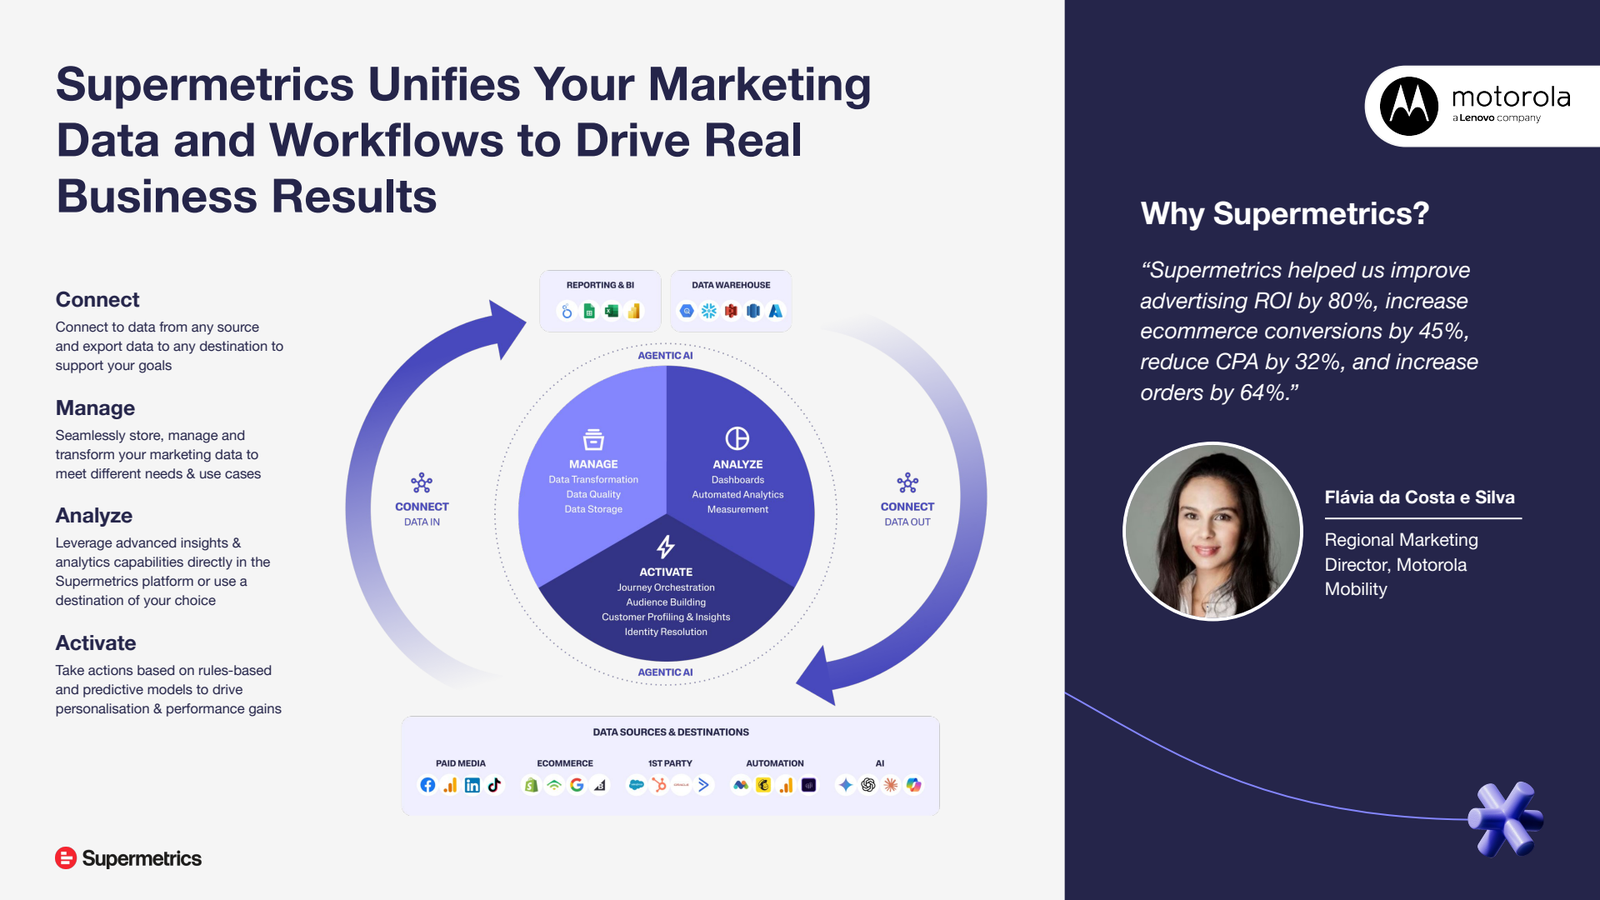 The full lifecycle: Connect, Manage, Analyze, and Activate, driving measurable commercial outcomes for enterprise brands like Motorola.
During the keynote, I outlined the operational framework we use at Supermetrics to help organizations transition away from vanity reporting and toward commercial impact: the four-stage lifecycle of Connect, Manage, Analyze, and Activate.
- Connect: Ingesting raw data from 150+ marketing, CRM, and offline retail sources. Hand-coding custom connectors for dozens of ad platforms is an engineering sinkhole. Managed connectors abstract API version updates, rate limiting, and token refreshes.
- Manage: Cleansing, normalizing, deduplicating, and mapping disparate datasets into unified schemas within BigQuery, Snowflake, or Azure, ensuring impression metrics across TikTok, Meta, and Google Ads share consistent dimensional definitions.
- Analyze: Moving beyond descriptive reporting into diagnostic and predictive modeling, including Media Mix Modeling (MMM), multi-touch attribution experiments, and customer lifetime value cohorting.
- Activate: Feeding analytical models directly back into operational systems. High-propensity audience cohorts, churn-risk flags, and automated bid rules must flow back into ad networks and CRM platforms in real time.
The commercial dividend of completing this cycle was demonstrated through our enterprise engagement with Motorola Mobility. Flávia da Costa e Silva, Regional Marketing Director at Motorola Mobility, detailed how moving from fragmented regional reporting to a unified intelligence stack altered their operating metrics.
By unifying marketing and retail data across global markets, Motorola eliminated blind spots that previously caused media waste. The verified results highlight the power of systemic data hygiene: an 80 percent improvement in advertising ROI, a 45 percent increase in e-commerce conversions, a 32 percent reduction in CPA, and a 64 percent increase in total orders. These gains were not creative accidents; they were the mathematical outcome of closing the loop between data ingestion and live campaign bidding.
Headless Architecture: Unlocking the Unit Economics of Innovation
A central topic of discussion in Copenhagen was the transition toward headless data infrastructure. In traditional models, data integration and visualization are tightly coupled: purchasing an analytics tool forces you into its proprietary dashboard interface.
For digital agencies and independent software vendors, that bundling destroys product agility. Consider Alvie by Precis, the proprietary technology arm of Nordic digital marketing agency Precis Digital. Jonas Bæk, Head of Product at Alvie, highlighted this reality during our review:
“Being able to focus on the insights (without having to keep building more integrations) allows us to reach a whole new set of customers we couldn’t support before. The unit economics simply wouldn’t have made sense without Supermetrics.”
Alvie needed to build bespoke marketing intelligence software, proprietary MMM engines, and custom client dashboards. If their engineering team had been forced to maintain custom ingestion connectors for every client ad platform, maintenance overhead would have consumed their engineering payroll. By building on top of Supermetrics headless APIs and managed warehouse connectors across GCP, AWS, and Azure, Alvie decoupled ingestion from client delivery. Supermetrics handles the unglamorous data plumbing, freeing Alvie’s data scientists to build proprietary attribution models and custom LLM workflows that deliver genuine client differentiation.
Closing the Loop: First-Party Activation and the Relay42 Deployment at Levi’s
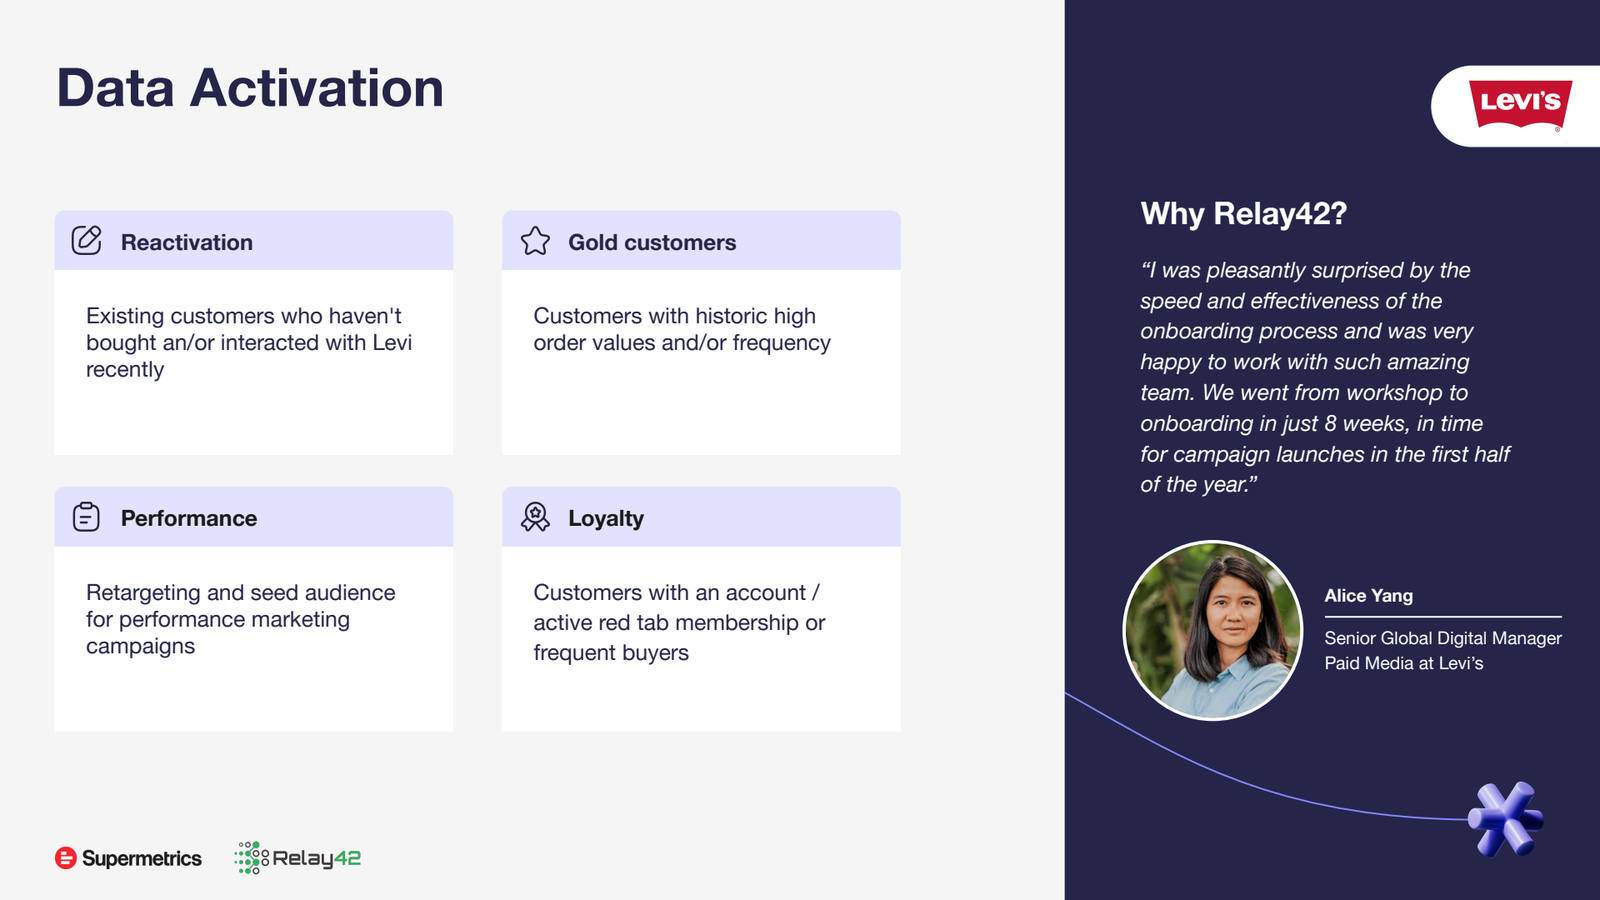 Moving up the stack: Levi’s and Relay42 illustrating how customer profiling turns unified data into actionable omnichannel activation.
The fourth pillar of our framework (Data Activation) has become the defining focus of marketing engineering. The acquisition of Relay42, an enterprise campaign Customer Data Platform (CDP), marked Supermetrics’ expansion from data collection into upstream audience execution.
With cookie deprecation and privacy-centric platform sandboxes, relying on native ad network pixels is a losing proposition. Enterprise brands must build first-party identity graphs and use them to orchestrate omnichannel campaigns.
A clear example is the deployment at Levi Strauss & Co. Alice Yang, Senior Global Digital Manager for Paid Media at Levi’s, shared how their team deployed Relay42 to move from theoretical audience segmentation to live campaign execution in just eight weeks, ready for critical first-half marketing pushes.
The Levi’s architecture operationalizes four core customer segments:
- Reactivation: Identifying dormant customers with zero recent purchase activity or digital engagement, suppressing them from expensive broad retargeting, and directing them into dedicated re-engagement sequences.
- Gold Customers: Dynamic segmentation of VIP cohorts with historically high order values and purchase frequency, protecting them from excessive discounting while granting priority product access.
- Performance: Generating real-time, privacy-compliant seed audiences from verified high-value purchasers and delivering them directly into programmatic bidding systems for lookalike modeling.
- Loyalty: Unifying physical retail transactions with e-commerce behavior, synchronizing active Red Tab membership accounts across owned email channels and paid social feeds.
When audience segmentation operates with this degree of architectural precision, data ceases to be a post-mortem reporting chore. It becomes an active driver of top-line revenue.
Ecosystems and Community: The Human Infrastructure
 Connecting with ecosystem partners: visiting the Google Copenhagen office following Web Analytics Wednesday.
Following the evening session at Web Analytics Wednesday, our Supermetrics delegation (including Mariia Zubova, Lucas Jakobsen, Emil Berglund, Joonas Antikainen, and Sahra Kahim) visited key ecosystem partners in Copenhagen, including Google’s Danish headquarters.
Standing in the Google Copenhagen office before their iconic bicycle installation wall, the duality of our industry was evident. Modern marketing analytics operates in close partnership with platform giants: we rely on their ad networks for distribution and their cloud data warehouses like BigQuery for storage. Yet our responsibility as solutions architects is to ensure client data models retain independent integrity, reflecting commercial reality rather than platform-favorable attribution claims.
Maintaining that independence requires human community. Throughout my talk, I encouraged the audience to apply the “Practitioner Rule of Two” when planning their professional trajectories:
First: What problems do I want to solve? Be deliberate about where you invest your intellectual capacity. Do you want to spend your career manually downloading CSVs and fixing broken formulas? Or do you want to master statistical incrementality, customer data architecture, and predictive activation?
Second: Who do I want to solve them with? Curate the colleagues, vendor partners, and peer networks you collaborate with. The professionals gathered in Copenhagen were not competitors; they were practitioners confronting the same schema changes, privacy constraints, and organizational data debt.
The actionable takeaway for attendees came down to two immediate commitments:
On the human axis, avoid collecting superficial contacts. Leave every gathering with one deliberate follow-up: schedule a focused twenty-minute discussion with one peer tackling your exact operational bottleneck.
On the technical axis, identify a single recurring data friction point: a reporting workflow, attribution calculation, or audience export consuming three hours of manual labor every week. Automate that pipeline end-to-end (from connector to warehouse model to shareable dashboard) and ship that concrete win before tackling broader organizational initiatives.
The Structural Future of Marketing Engineering
The lasting lesson from Web Analytics Wednesday Copenhagen extends beyond any single platform, connector, or case study.
We are witnessing the permanent convergence of data engineering, performance marketing, and software architecture. The era when a marketer could manage ad spend purely on intuition while an analyst built disconnected dashboards in an organizational silo has drawn to a close. The economics of modern customer acquisition are too unforgiving, and the underlying data infrastructure is too intricate.
The organizations and practitioners that thrive in this environment will not be those that collect sprawling, disconnected software tools. They will be those that master the fundamentals of connection: engineering clean, automated data pipelines that transform raw ad exhaust into commercial action, while deliberately cultivating the professional relationships that turn technical capability into durable impact.